October 4, 2017
Sierra Platinum
We present the latest result of our research: Sierra Platinum is a fast and robust peak-caller for replicated ChIP-seq experiments with visual quality-control and -steering. It allows to generate peaks while the user influences, which replicates are most suitable for creating them. The results show that the new method outperforms available tools and methodologies.
Introduction
One important topic in Bioinformatics and Biology is studying diseases that are caused by genetic defects. For a long time it was supposed that the genome is responsible for all properties, e. g., hair and eye color, gender, and size. At the beginning of this millennium, however, a new field besides genetics appeared: epigenetics. Epigenetics studies the hertiable changes in the cell nuclei that do not stem from the genome, only. In fact, the cell type, e. g., brain cells, muscle cells, or tissue cells, is not determined by the genome. All cells contain more or less identical genomes (changes due to copying during cell replication might occur). Epigenetic features determine the cell type.
The genome can be considered as a long sequence of molecules, the so-called nucleotides. However, if the genome is unfolded as a straight line, it would not fit in a human cell. In fact, it is tightly folded inside the cell’s nucleus. For this, it is wrapped around a complex of eight proteins, the so-called histones. This histone complex and the DNA wrapped around it are also called nucleosome. The proteins can be modified. One possible type of modification is called methylation, where a methylgroup is added to the protein. The proteins are very large, thus that methylations can occur at many different places at the protein.
Goal
One important field of study is which and how histones are modified, and how this is related to cell types, expression of genes, and also to diseases. But how can these parts of the genome, where histones are modified, be found?
In principle, a sample of similar cells is collected and tested. First, we want to know, where at the genome are the histones. This forms our basis called background. Second, we want to know if the histones found are modified. This forms the test called experiment. Both together form a data set. What we get after analyzing and some (in fact quite complex) preprocessing, is an annotated genome, where we have a sequence of nucleotides and the information whether this sequence is associated with a histone (background) and if this histone is modified (experiment). However, the latter information is not directly encoded in the data. It has to be extracted from the data by a peak-caller.
Peak-Calling
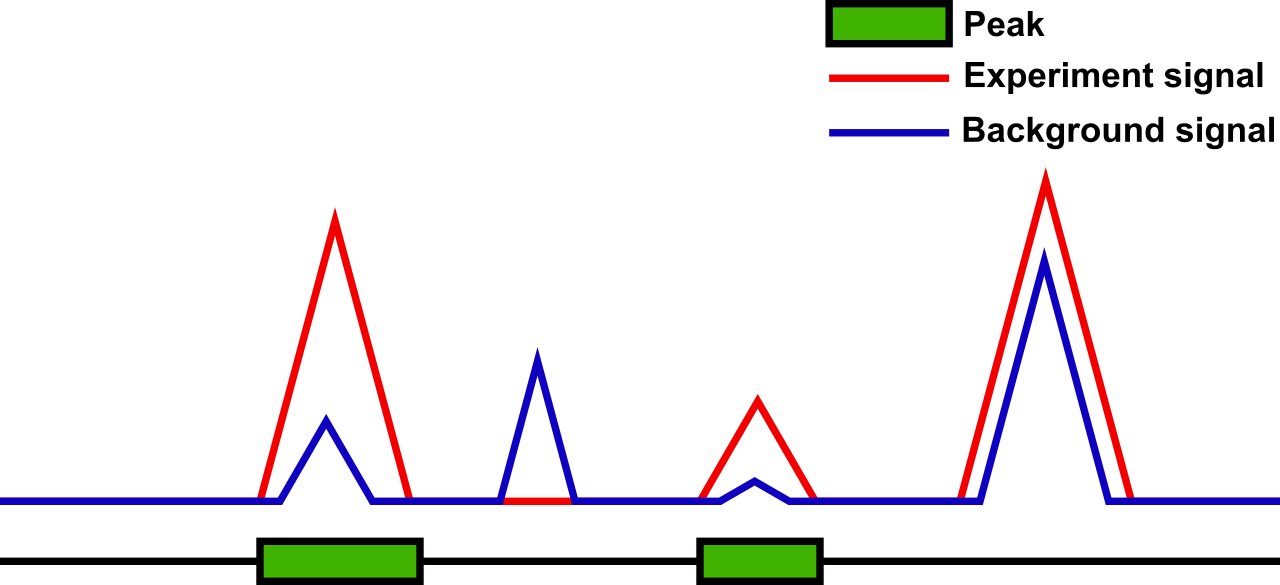
So, what does a peak-caller do? The background forms a signal with ridges and valleys. So does the experiment. In Figure 1, the experiment signal is shown in red, the background signal is shown in blue, and peaks are shown as green boxes. If we compare the experiment signal to the background signal, we get three basic results:
- the experiment signal is lower than the background signal (second)
- the experiment signal is equal to the background signal (not shown)
- the experiment signal is larger than the background signal (first, third, and fourth).
While case (1) might happen due to the variation in the measurements. Anyway in both cases (1) and (2), we can safely assume that there is no modification of the histone due to our measurements. Case (3), however, is not that obvious. In fact, here, we need to check how much larger the experiment signal is compared to the background signal. For this, a statistical analysis is used. If the experiment is significantly larger than the background, a modified histone is assumed (first, third) otherwise an un-modified histone is assumed (fourth). This allows to find segments of the genome that are unmodified and those that are modified. The modified segments are called peaks and are reported by the peak-callers.

Figure 1: Peak detection with four different situations (from left to right): pea – the experiment signal is significantly larger than the background signal (both are comparatively large) / no peak – the experiment signal is lower than the background signal / peak – the experiment signal is significantly larger than the background signal (both are comparatively small) / no peak – the experiment signal is larger but not significantly larger than the background signal.
Multi-Replicate Peak-Calling
Quite some peak-caller exist that can find peaks for single experiment-background pairs. Lately, however, the measurement protocol got that cheap that replicates are affordable. The same cell sample is divided into several parts, each part is sent to sequencing to perform the measurements for background and experiment. This leads to several replicates of the resulting background and experiment data sets.
Now, peak-calling becomes more involved. Most available peak-callers could not handle these situations. Thus, two methods were created to handle replicates. The first combines all background and all experiment data sets, and uses the combined data sets as input for single data set peak-caller. The other method creates peaks for each data set and then combines the results. Both methods are problematic. For the first method, it is assumed, that the number of elements determining the signal is the same for both background and experiment. For the second method, peaks that are not reliable might be included in the final result. In both methods, it can not easily be decided how good a data set matches the final results. Moreover, if the quality of a data set is bad, it ought to be excluded or contribute less to the overall result.
Only one peak-caller called PePr can handle replicates. However, the underlying mathematical model does not match the replication assumptions and the results from tests where not convincing.
Sierra Platinum
Therefore, we developed a new approach that allows to handle replicated measurements leading to several pairs of background and experiment called replicate. In addition, we also wanted to go one step further. Most current peak-caller are batch programs: given the data sets and some parameters as input they produce a list of peaks as output. Important information about the data is thus lost. Our approach combines the computation of the final result—the list of peaks—with additional statistics about the data. One example is the determination of the moments of the underlying distribution. The distribution is a mathematical model of the data. A moment is for example the average value of the data. If the found distributions and their parameters match the theoretical assumptions, then it is valid to apply the proposed peak-calling approach. Otherwise, it should be considered not to use the data set.
Computing these statistical measurements is only one part. The second part is to visualize this statistical information using adapted visualizations. The visualizations allow the analyst to literally see whether or not one of the data sets has a problem. Further, they allow to see the correlation among the replicates and the contribution of each data set to the final result—the list of peaks. If a data set has low quality it can either be completely excluded from the determination of the peaks, or its influence on the result can be reduced.
Results
Tests with artificial (we generated test data sets) and real data showed, that the quality of the resulting list of peaks is high and thus, that our method is reliable. Moreover, our expectation with respect to finding “bad” data sets visually were fulfilled. Due to our efforts of reducing time and space requirements of the computations the amount of resources needed (computation time and space) is acceptable. A complete (scientific) description can be found in our refereed publication Sierra platinum: a fast and robust peak-caller for replicated ChIP-seq experiments with visual quality-control and -steering.


