July 4, 2023
Data Science Challenge: 3rd Place
On 07.03.2023, four teams presented their results of the ScaDS.AI Dresden/Leipzig Data Science Challenge at the 20th Conference on Database Systems for Business, Technology and Web (BTW) in Dresden.
The challenge for the applicants was to choose a metropolitan area or a city with a sufficient density of sensors and other publicly available geodata for an analysis. The teams were tasked to find interesting facts and patterns in the data sources. On that basis, they were creating an analysis that answers a question of social relevance. Consequently, analyzing publicly available urban bicycle traffic data and other urban geographical data has advantages. For instance, it can help connect individual perspectives to analyze the big picture of urban bicycle infrastructure in future projects.
As a result, the participants presented or visualized their analysis in purely textual form. A jury of experts from research, cities and industry evaluated their projects and announced the placings on March 8th 2023:
- 1st place: Recommending Alternative Cycling Routes via Predicted Usage Patterns (Men, Dakai; Becktepe, Jannis; Esmailoghli, Mahdi; Bermbach, David; Abedjan, Ziawasch)
- 2nd place: Predicting Bike Traffic Using Graph Neural Networks: Integrating Residential Density, Amenity Distribution, and Street Networks (Chou, Wen-Chuang)
- Two 3rd places: Analyzing Cargo Bike Usage in Leipzig for Improved Bike-Sharing System (Petersen, Hauke; Plank, Martin) und In-Database Machine Learning on Bicycle Data from Munich (Großmann, Christoph)
The first three places were rewarded with a prize money from a pool of 1000 euros.
3rd Place of the Data Science Challenge 2023
The following paragraph provides an abstract of the project “In-Database Machine Learning on Bicycle Data from Munich” by Christoph Großmann:
The difference between this approach to bicycle data analysis and typical approaches is, that this approach uses an Exasol database as the main storage and the main platform for executing analytical logic.
Exasol can already be extended for machine learning using so-called user-defined function (UDF) scripts. The framework uses this functionality to provide a natural SQL integration for machine-learning algorithms. Thus, the framework creates an interface to access algorithms of the Python library Scitkit-Learn in SQL.
The main contributions of the framework are the support for exploratory data analysis, increased scalability and cloud compatibility using Exasol clusters, increased efficiency, increased security, and simplification.
For this analysis, Munich was chosen because of its robust set of bicycle data (“Raddauerzählstellen”) from the 2017 to 2022.
This project has three focus points:
- Correlation between Rain and Bicycle Traffic
- Evaluation of Changes in Bicycle Traffic over the Years
- Prediction of Bicycle Traffic by Daily Weather
By using plain SQL functions a correlation between the amount of rain and bicycle traffic can be shown. Furthermore, the results show the overall increase in bicycle traffic over the years of data collection. To predict the bicycle traffic on a given day using the weather forecast, a machine-learning model is needed.
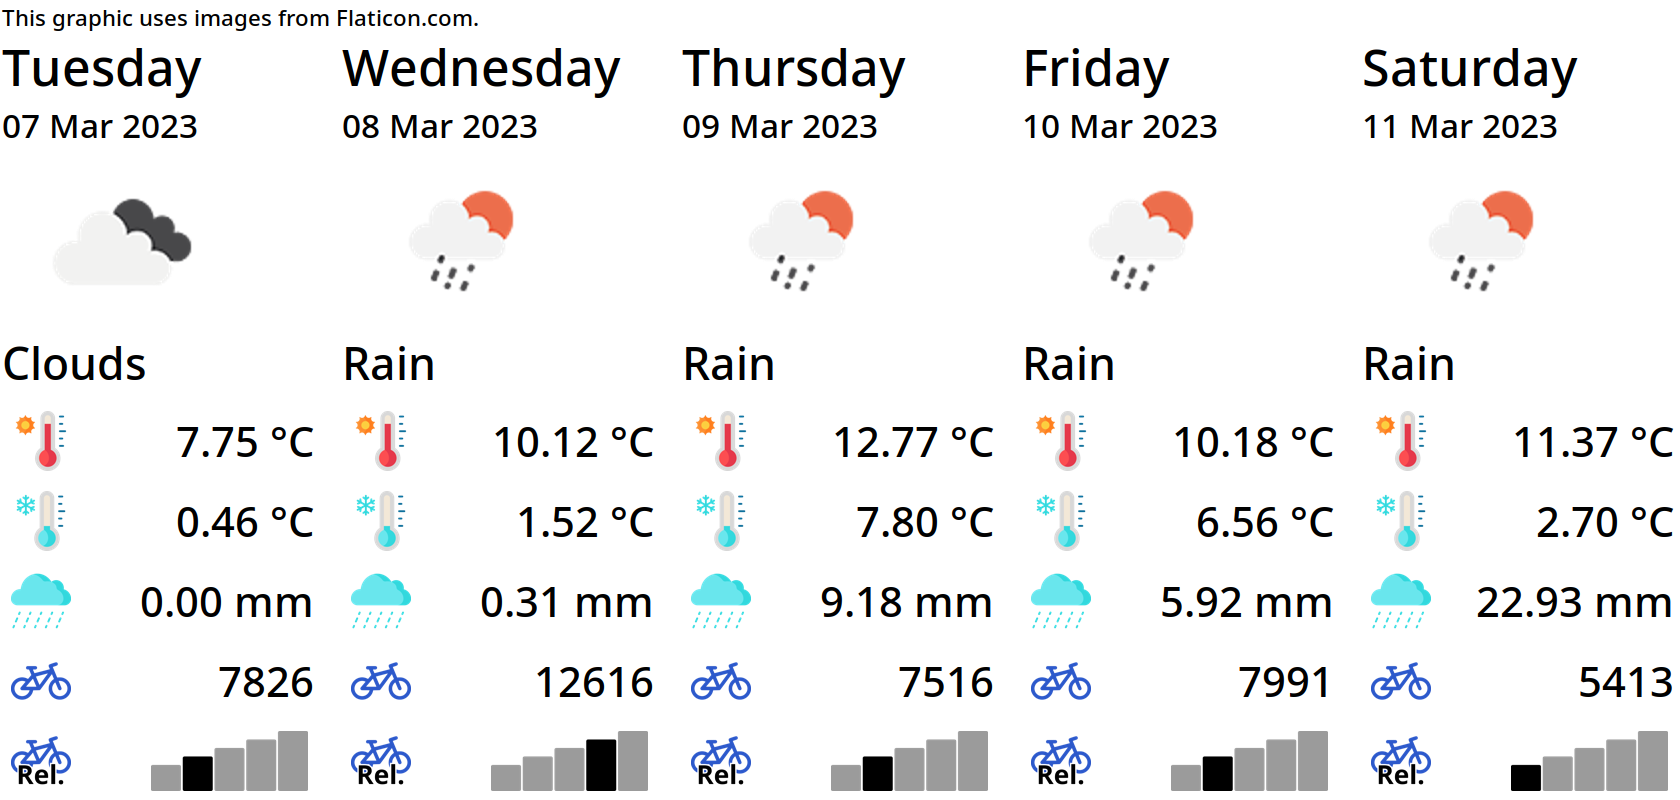
Finally, the output of the prediction can now be used to show the bicycle traffic prediction in addition to the weather forecast. In addition, to make this information easily understandable for a user, graphical output is advantageous. For this application, a GUI using tkinter was created. More about this analysis can be read here:
The results of the teams were evaluated according to various criteria, such as Social relevance and Data visualization. We thank all participants for their engagement and interesting projects!
