July 20, 2017
Virtual Cloud Infrastructure for Data Analysis
Transfer and Service
Nowadays, data analysis is one of the crucial parts in the field of science and research and in business as well. The data analysis process includes different steps and areas. These are mainly data collection, data pre-processing (checking, cleaning etc.), data analysis itself and visualization/interpretation of the results. Thereby, every single step can be realized by using a big variety of tools.
Developing an efficient and powerful analysis process, especially in connection with big data, can be a technical challenge. Therefore it is of advantage, to have an infrastructure that allows testing, modifying and evaluating every single part of the analysis as well as the whole process. The cloud structure as described in this article provides a cost-efficient and flexible platform in order to develop and evaluate complex data analysis processes. In the following article, an example of the cloud infrastructure itself is presented at first. In the second part, we demonstrate an application of the infrastructure in order to realize a data analysis task.
Cloud Infrastructure
The infrastructure for the Data analysis platform is running in the Cloud Cluster of ScaDS. The Cloud Cluster is implemented as a private cloud for ScaDS. That is the Cloud Cluster is a private cloud especially meant for ScaDS which is not accessible by the public. The access to the cluster for public can be possible only according to the necessity. In this cluster, a virtual environment is created as the infrastructure for Data analysis. It consists of Virtual Machines with different configurations to support the analysis platform. All the Virtual Machines can communicate with each other using the software defined virtual networks in the cloud platform. All the Virtual Machines can communicate with HPC machines and also fetch data from HPC machines. It is also possible to use different shared file system protocols like NFS, HDFS, GlusterFS etc. to share the data between the Virtual Machines.
In order to perform some data analysis the frameworks and tools available in the VMs can be used, e.g.
- R + RStudio-Server,
- Python,
- Database (SQL, Cassandra),
- BigData Frameworks.
Thereby, the Virtual Machines are configured according to the requirements of users for testing and development purposes. The advantage of a virtual cloud environment is that users do not need to take care of software installation and maintenance. The required software will be installed by ScaDS on the corresponding Virtual Machine. It is also easy to scale this infrastructure if more computing resources are needed. Finally, users can transfer their data into a suitable Virtual Machine and run an analysis using the tools therein. Establishing a proper network pipeline to the cloud infrastructure allows for streaming the data and analyzing it immediately. Furthermore, there is no need to reserve the resources for a particular time period already for testing purposes like in HPC machines. Thereby, the infrastructure is permanently available, i.e. users can log in to the Virtual Machine for running tasks and looking into results anytime.
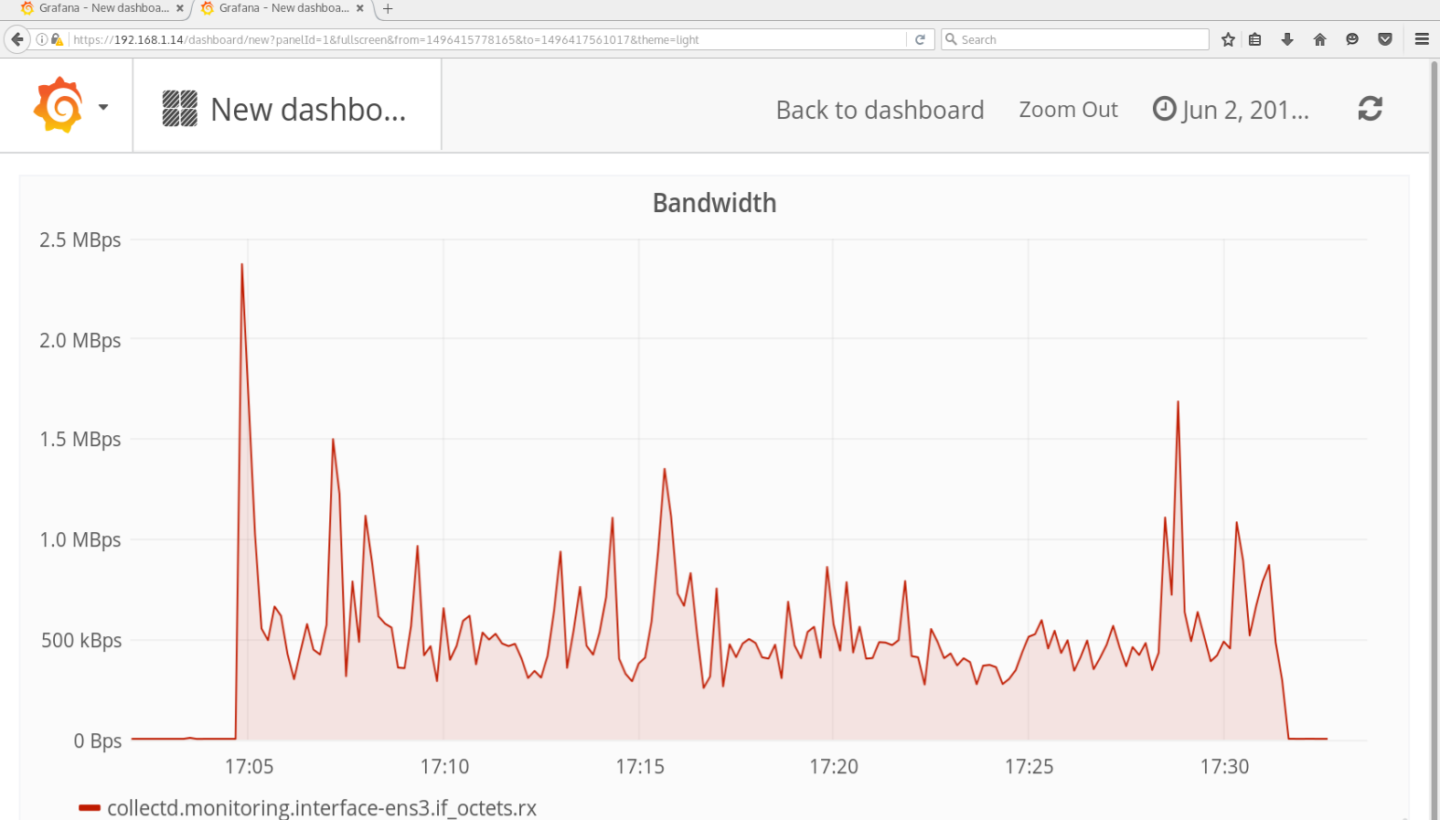
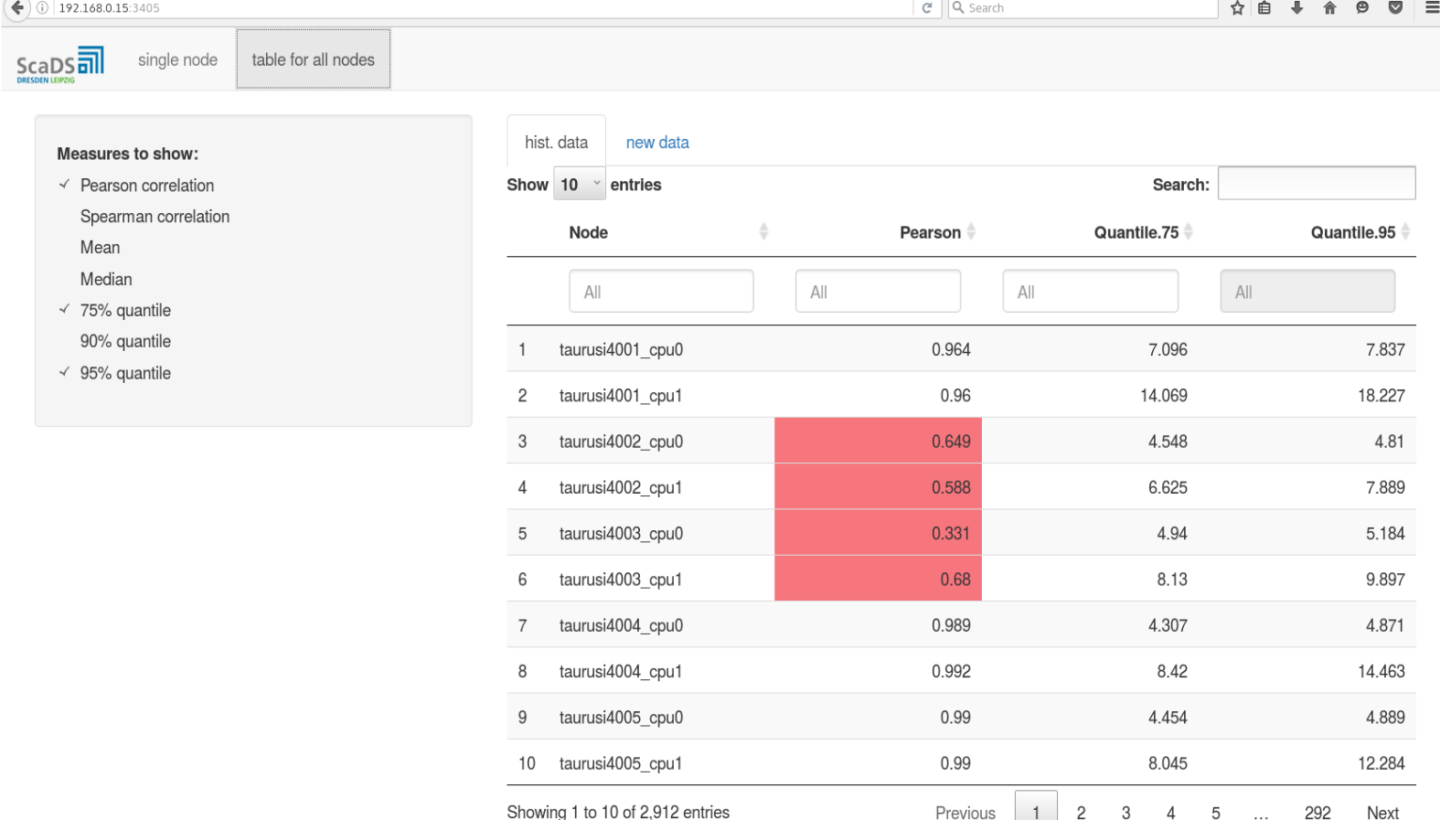
A separate Virtual Machine is maintained to collect the performance metrics over all Virtual Machines. The monitoring Virtual Machine can inspect the performance of the cloud infrastructure and also the performance of tasks running in every single Virtual Machine. A web interface is available, where users can see the performance metrics. Figure 2 shows the bandwidth evaluation of one of the Virtual Machines while downloading a dataset of 1.5 GB. Such performance metrics can be used to optimize programs and services running in the Virtual Machine.
Application: Data Analysis with R and Python
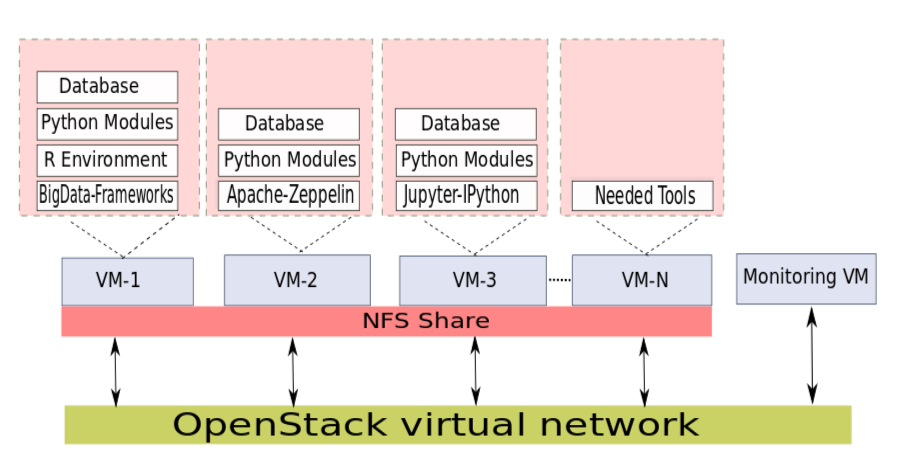
In this section we describe an application of the above presented infrastructure. The main purpose herein is an evaluation of sensor data from “Taurus” (this is the name of an HPC machine from the ZIH. The data mainly focused for analysis is sensor data, esp. temperature and power data, which is typically time series data. Thereby, we are interested in anomalies that could indicate problems in the cooling system of “Taurus”. Figure 1 shows the cloud architecture applied for this data analysis. The cloud infrastructure is able to collect offline and online data from “Taurus”.
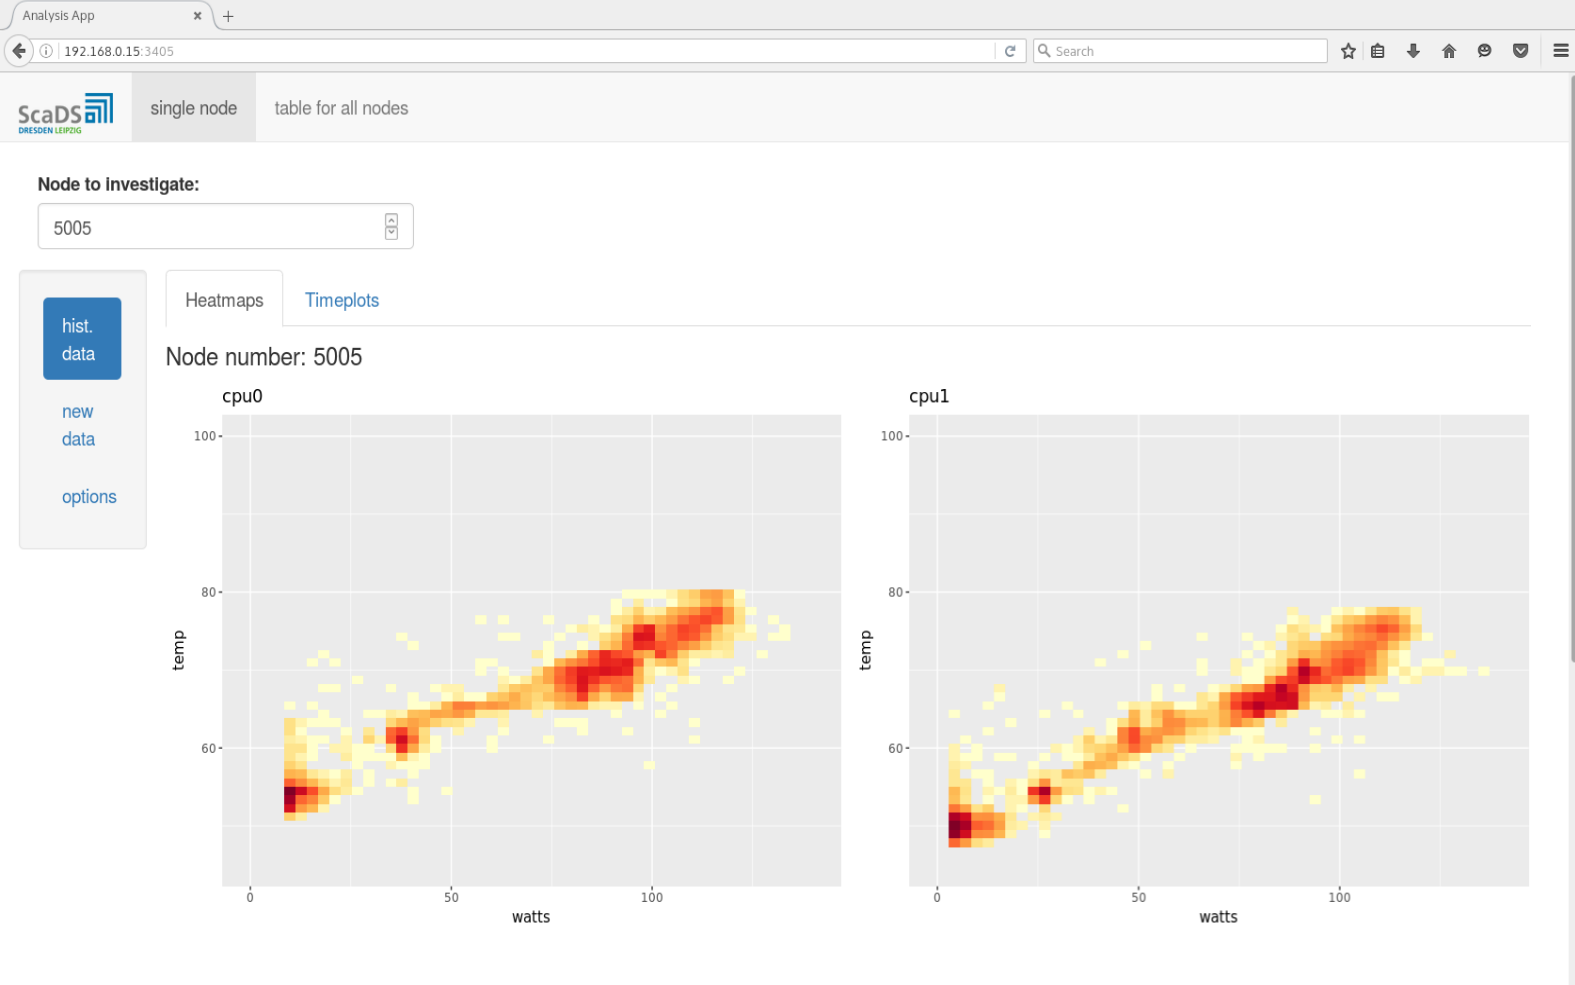
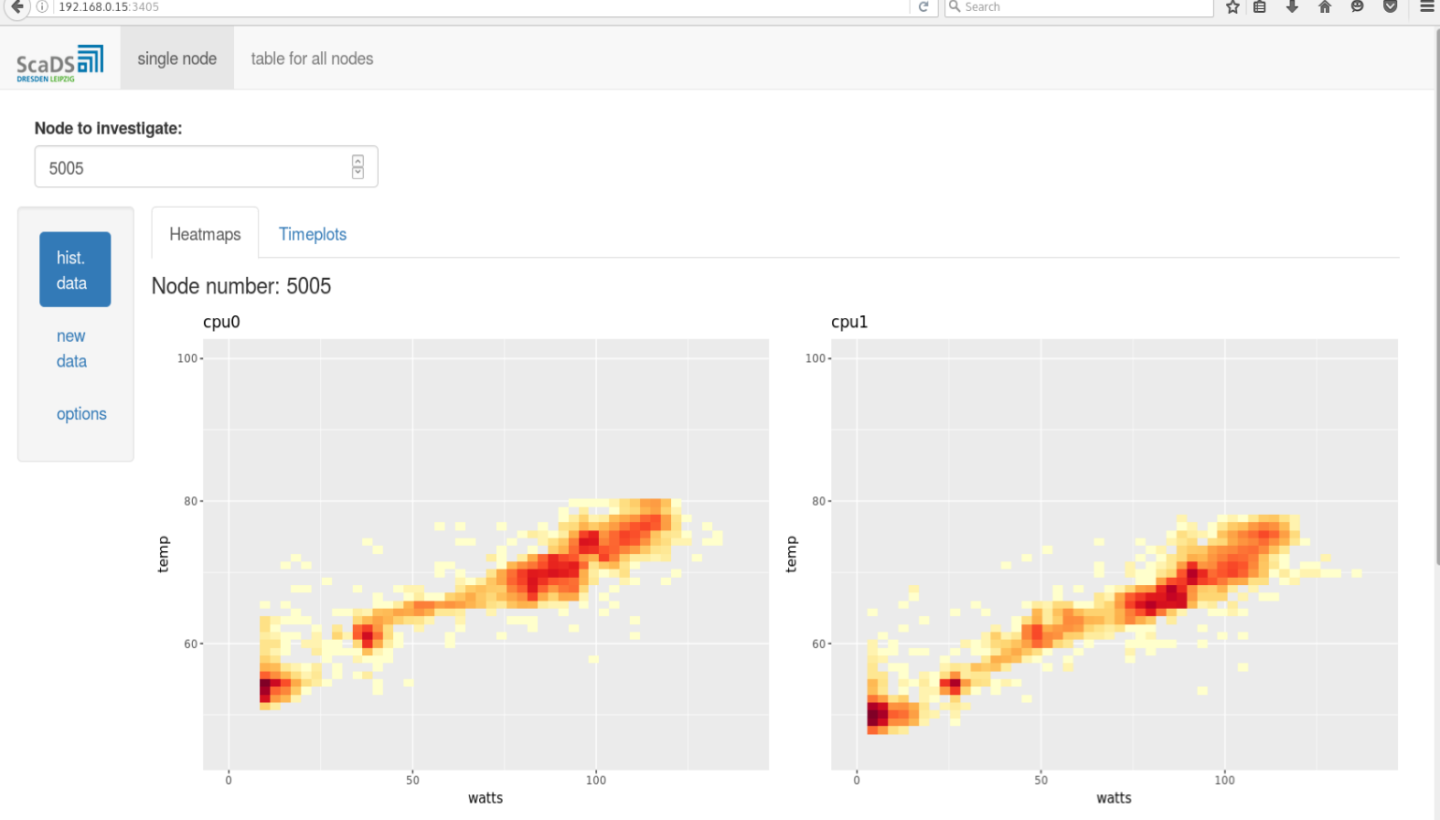
R environment for statistical analysis is available in a Virtual Machine. The core R installation is extended with RStudio-Server, which is an integrated development environment (IDE) for R with many nice features (code-completion and syntax-highlighting, as well as tools for plotting and debugging and many others). Furthermore, the package “shiny” is installed. The “shiny”-package allows using a Virtual Machine for hosting web applications for statistical analysis and making the results available in a browser for every user, with having only a link. The example of such a “shiny”-application is illustrated in Figures 3 and 4.
Another possibility to provide a user-friendly web interface is an implementation by means of a Jupyter-notebook. Thereby, the Python programming language is used in the backend. This possibility also was realized within the cloud infrastructure above by using a separate Virtual Machine. Both web applications can be used in order to analyze offline data and streaming data as well. BigData Frameworks like Apache Spark and Apache Flink is also available in the infrastructure for processing the collected data.
There are three main advantages of such web applications. They are platform independent (only a web-browser is required), the whole functionality of R (or Python) is available beneath a simple and intuitive web page and they are highly flexible, i.e. an individual adjustment is possible.
Conclusion
In this article we describe a possible architecture of virtual cloud infrastructure for data analysis. An application of the virtual cloud infrastructure for analyzing sensor data from the HPC machine “Taurus” is demonstrated and some basic functionalities are explained. Thereby, R and Python are used in order to analyze data and provide the possibility of user interaction as well. Finally, there is the advantage of portability of well-working Virtual Machines by means of snapshots which can be replicated and recreated arbitrarily. Moreover, the employment of Virtual Machines is not restricted to data analysis, but also for developing, testing and optimizing applications as well as interconnections and single parts of a whole working process.The bottom line is, using a virtual cloud infrastructure is time-saving and cost-efficient esp. referring setup and maintenance and it allows for highly flexible user-specific adjustments.


funded by:
ScaDS.AI Dresden/Leipzig (Center for Scalable Data Analytics and Artificial Intelligence) is a center for Data Science, Artificial Intelligence and Big Data with locations in Dresden and Leipzig.
Dresden
Visitor address
Technische Universität Dresden
ScaDS.AI Dresden/Leipzig
Bürogebäude Strehlener Straße
Strehlener Straße 12, 14
01069 Dresden
ScaDS.AI Dresden/Leipzig
Bürogebäude Strehlener Straße
Strehlener Straße 12, 14
01069 Dresden
Postal address
Technische Universität Dresden
Zentrum für Informationsdienste und Hochleistungsrechnen
ScaDS.AI Dresden/Leipzig
01062 Dresden
Zentrum für Informationsdienste und Hochleistungsrechnen
ScaDS.AI Dresden/Leipzig
01062 Dresden
Leipzig
Visitor address
ScaDS.AI Dresden/Leipzig
Löhrs Carré
Humboldtstraße 25, Uferstr. 11
04105 Leipzig
Löhrs Carré
Humboldtstraße 25, Uferstr. 11
04105 Leipzig
Postal address
Universität Leipzig
Data Science Center ScaDS.AI Leipzig
Internes Postfach: 322001
04081 Leipzig
Data Science Center ScaDS.AI Leipzig
Internes Postfach: 322001
04081 Leipzig
Quicklinks:
Copyright 2026 © SCADS.AI Dresden/Leipzig – All rights reserved.