November 14, 2016
Graph Mining for Advanced Data Analytics
Research
In order to answer complex analytical questions, data mining methods are often combined with other data processing steps, for example to prepare the search space or to process results. To enable the combination of data mining algorithms and other operators, productive data mining solutions offer extensive toolkits for the analysis of relational or multidimensional data. However, the situation differs with regard to the less established methods of graph mining. Although there are research prototypes, there is no solution that supports complex analytical programs composed from multiple graph operations.
Gradoop, an Open Source system developed at the Leipzig University and the ScaDS Dresden/Leipzig, aims at changing this. Gradoop is the first system that supports the combination of multiple graph algorithms and graph operators in a single script. Hence, Gradoop enables new applications, for example, graph-based analyses of business data. Built on state-of-the-art Big Data technology, Gradoop not only offers a unique range of functionality, but is also out-of-the-box horizontally scalable. It further provides an interface for plug-in algorithms and is thus open to application-specific extensions.
Graphs for business analytics
The first graph mining technique available in Gradoop allows to find frequent patterns (Frequent Subgraph Mining). Similar to the relational counterpart (Frequent Itemset Mining), frequently occurring entities are evaluated. In the example of a classical shopping basket analysis, a pattern represents a certain combination of products. Those could be bread, butter and milk. However, in practical application scenarios, analytical questions are rarely as simple as in textbooks. For example, to optimize a webshop, not only products bought together could be of interest. Frequently occurring product groups in canceled order processes could be interesting, too.
To answer such more complex questions, several steps of data processing are required. Before the actual algorithm is executed, canceled orders must be filtered and products have to be replaced by representatives of their groups. For relational and multidimensional data there already exist productive solutions supporting such multi-stage analyzes in a flexible manner. This is different with regard to graph data. But why should one use the graph model?
In addition to the common occurrence of certain entities (vertices), graph patterns additionally include their relationships (edges). One way to analyze business data is representing all data recorded during the execution of business processes by a collection of graphs. Here, every graph represents a single process execution. For example, a graph contains all the data around an online trading process:
- customer’s order
- purchasing and warehouse operations
- delivery data.
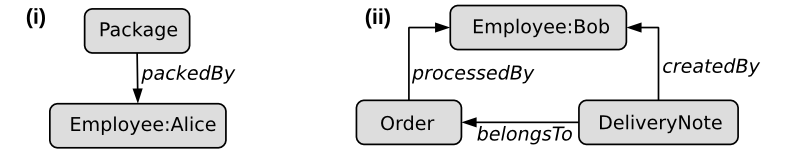
Vertices can be either master data like employees and products or transactional data like invoices and delivery notes. Edges additionally provide information about relationships, for example, which employee has processed the packaging step. By representing process data by graph collections, one can identify patterns. Those represent the joint occurrence of certain master data as well as their roles in the process.
Such pattern-driven analyses are especially of interest with regard to their economic context like correlations among patterns and complaints. But which steps are necessary to find such patterns?
First, graphs containing complaints must be identified and filtered. Second, let us also assume that vertices describe business objects of certain types (e.g. employee, invoice, product) including properties (e.g. identifiers or prices). To increase expressiveness of resulting patterns, we are interested in information about concrete master data instances but, as they represent processing steps, only transactional data types. To find respective patterns, the remaining graphs must be transformed to enable the common evaluation master data identifiers and transactional as well as relationship types. Figure 1 shows two example graph patterns meeting this requirement. One can see, that simple patterns (i) as well as more complex relationships (ii) can be found. With Gradoop, we are able to declare our example analysis including categorization, filtering, transformation and pattern mining in a single program.
Gradoop – functionality, technology and extensibility
Gradoop is a system for advanced analysis of graph data. By providing a declarative Java API, a user can flexibly create analytical scripts. These scripts allow the combination of several graph operators and algorithms. Gradoop is implemented as a 3rd party library on top of the Big Data platform Apache Flink. The fundamental concepts of platforms like Apache Flink or Apache Spark are distributed sets of data objects (DataSets) and transformations between DataSets (for example, map and reduce). Analytical programs in such systems can be represented by directed acyclic graphs (DAG), where vertices represent data sets and edges represent transformations. Compared to Hadoop MapReduce, these platforms offer a wider range of transformations (e.g., join, groupBy, sort).
Furthermore, data can be held in distributed main memory during the complete program execution. Gradoop internally maps graph data as well as operators and algorithms to Flinks’ data sets and transformations. For the declaration of analytical scripts, Gradoop transfers the DAG abstraction to graph analysis, where DAG vertices represent graph data and DAG edges are either graph operators or graph algorithms.
Reviewing libraries of Big Data platforms, there already exist other ones to analyze graph data. However, all of them use a, in comparison to Gradoop, less expressive graph model. The data model of Gradoop not only supports individual graphs but also graph collections. It is based on the popular property graph model, where application data (types, identifiers and properties) can not only be attached to vertices and edges, but also to graphs. Moreover, the data model includes several universally applicable operators whose input and output are either graphs or graph collections.
Thus, one can easily declare analytical programs and, unlike other libraries, development effort for data modeling and operator implementation is reduced. Furthermore, Gradoop offers several data sources and sinks, which can be used in scripts and, thus, help saving further development effort. In addition, there is no other library, which supports collections of graphs. However, the latter is absolutely necessary to enable cross-graph analyzes, such as the search for frequent patterns.
If an application requires custom algorithms in addition to the operators included in Gradoop, Gradoop provides the generic call operator. A compatible algorithm must be implemented using Apache Flink and meet a specific Java interface. In order to support various algorithms, Gradoop offers multiple interfaces to cover all possible input and output combinations of graphs and graph collections. A correspondingly implemented algorithm is seamlessly integratable into Gradoop scripts.
State of development
The current version 0.2 of Gradoop is a research prototype that already shows how different operators and algorithms can be combined to answer complex analytical questions while being executed in a horizontally scalable manner. The current research focus is the efficient mapping of complex graph algorithms to the programming concepts of Big Data platforms, in particular to those of Apache Flink. Major point of interest are algorithms that include the NP-complete subgraph isomorphism problem, for example, pattern matching and frequent subgraph mining. The current version contains functional implementations of both algorithms. However, they are continuously optimized by the results of ongoing research activity. It is further planned to extend the range of functionality by special operators for graph-based data integration.
Related Links
Recent slides of Data2Day 2016 (German)
Extended Introduction to Gradoop in JavaSPEKTRUM 05/2016 (German)
List of scientific publications
Gradoop on GitHub

funded by:

ScaDS.AI Dresden/Leipzig (Center for Scalable Data Analytics and Artificial Intelligence) is a center for Data Science, Artificial Intelligence and Big Data with locations in Dresden and Leipzig.
Dresden
Visitor address
Technische Universität Dresden
ScaDS.AI Dresden/Leipzig
Bürogebäude Strehlener Straße
Strehlener Straße 12, 14
01069 Dresden
ScaDS.AI Dresden/Leipzig
Bürogebäude Strehlener Straße
Strehlener Straße 12, 14
01069 Dresden
Postal address
Technische Universität Dresden
Zentrum für Informationsdienste und Hochleistungsrechnen
ScaDS.AI Dresden/Leipzig
01062 Dresden
Zentrum für Informationsdienste und Hochleistungsrechnen
ScaDS.AI Dresden/Leipzig
01062 Dresden
Leipzig
Visitor address
ScaDS.AI Dresden/Leipzig
Löhrs Carré
Humboldtstraße 25, Uferstr. 11
04105 Leipzig
Löhrs Carré
Humboldtstraße 25, Uferstr. 11
04105 Leipzig
Postal address
Universität Leipzig
Data Science Center ScaDS.AI Leipzig
Internes Postfach: 322001
04081 Leipzig
Data Science Center ScaDS.AI Leipzig
Internes Postfach: 322001
04081 Leipzig
Quicklinks:
Copyright 2026 © SCADS.AI Dresden/Leipzig – All rights reserved.